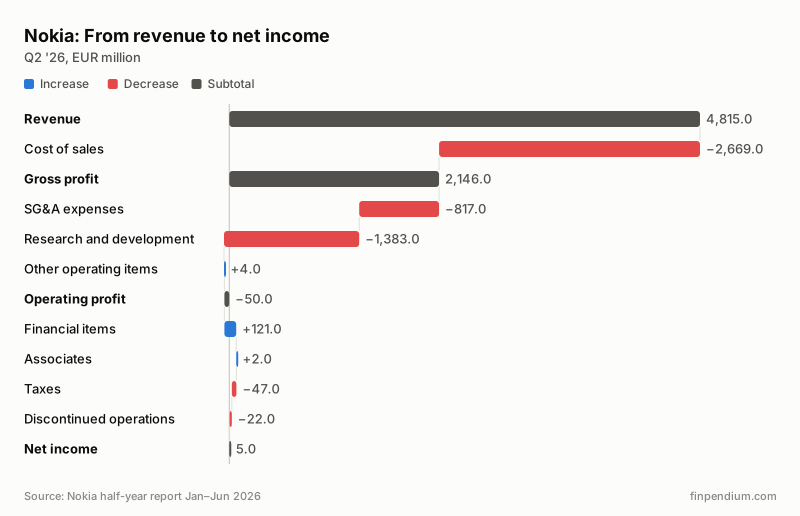
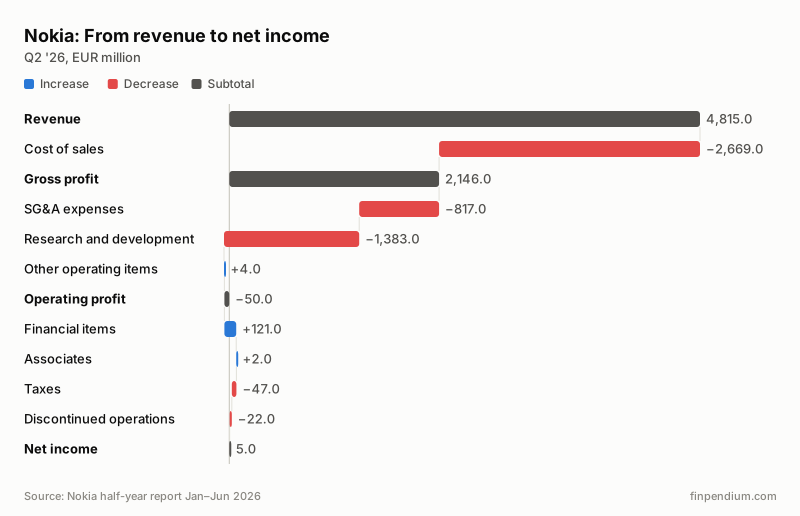
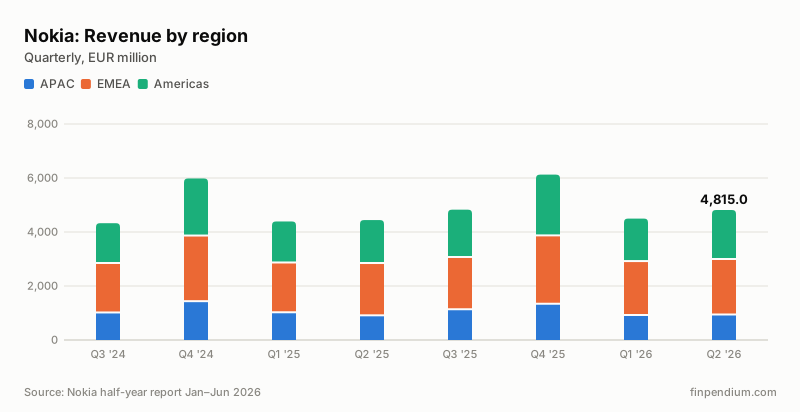
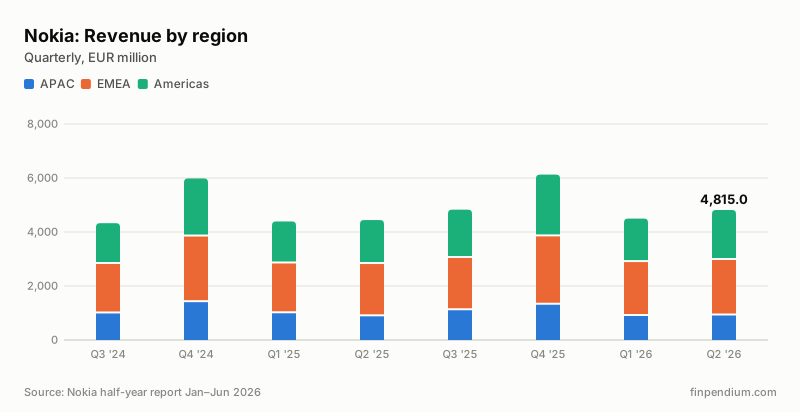
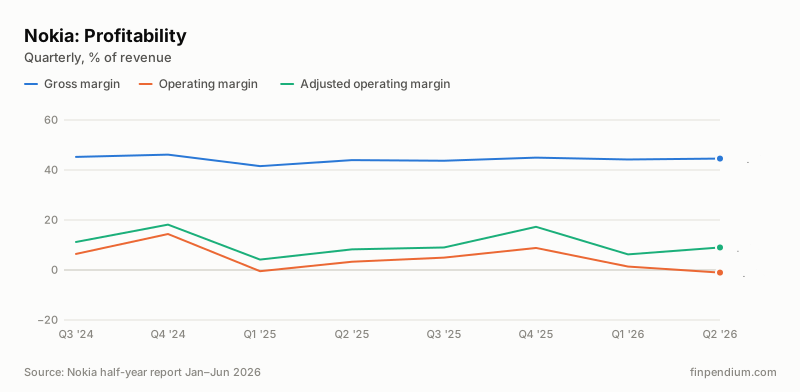
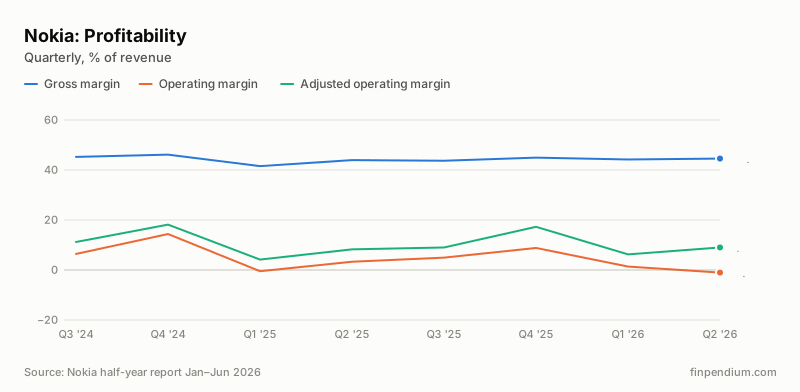
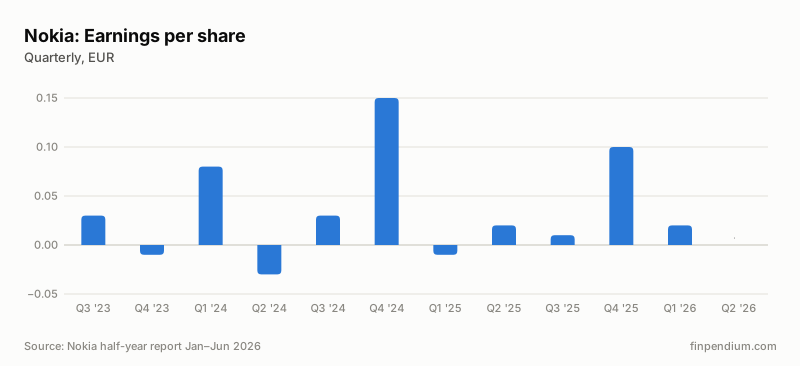
In Q2 2026, Nokia’s revenue was €4,815.0 million, up 8.4% from Q2 2025. Operating loss was €50.0 million, an operating margin of −1.0% (Q2 2025: 3.3%). Net income for the period was €5.0 million and earnings per share €0.00.
Nokia: From revenue to net income · Q2 '26, EUR millionEmbed this chart
Free to use with the credit link (CC BY 4.0). The embedded chart stays as it is for Q2 2026; this page shows the latest results. Open SVG
Key figures for Q2 2026
Nokia key figures, Q2 2026 vs Q2 2025
Q2 2026
Q2 2025
Change
Revenue, €M
4,815.0
4,443.0
+8.4%
Gross profit, €M
2,146.0
1,953.0
+9.9%
Gross margin
44.6%
44.0%
+0.6 pp
Operating profit, €M
−50.0
147.0
−134.0%
Operating margin
−1.0%
3.3%
−4.3 pp
Adjusted operating profit, €M
434.0
367.0
+18.3%
Net income, €M
5.0
96.0
−94.8%
Net margin
0.1%
2.2%
−2.1 pp
Earnings per share
€0.00
€0.02
−100.0%
Nokia in charts
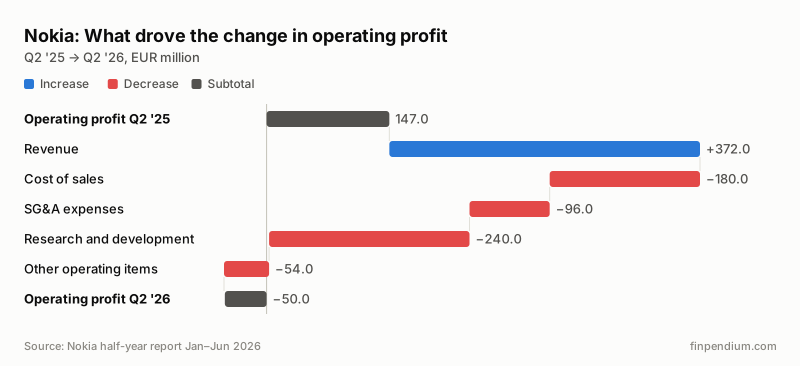
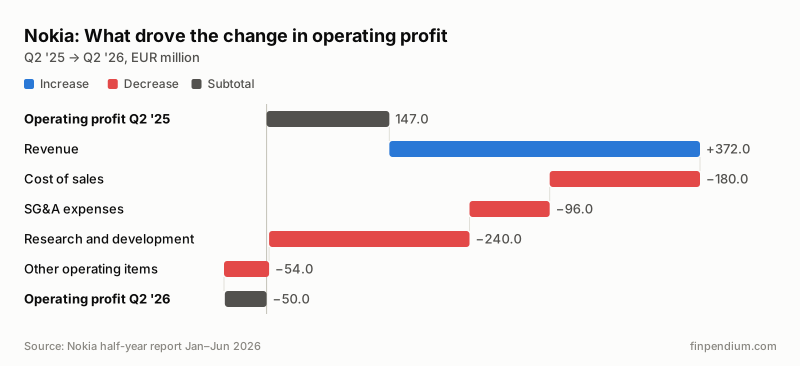
Nokia: What drove the change in operating profit · Q2 '25 → Q2 '26, EUR millionEmbed this chart
Free to use with the credit link (CC BY 4.0). The embedded chart stays as it is for Q2 2026; this page shows the latest results. Open SVG
Nokia: Revenue by region · Quarterly, EUR millionEmbed this chart
Free to use with the credit link (CC BY 4.0). The embedded chart stays as it is for Q2 2026; this page shows the latest results. Open SVG
Nokia: Profitability · Quarterly, % of revenueEmbed this chart
Free to use with the credit link (CC BY 4.0). The embedded chart stays as it is for Q2 2026; this page shows the latest results. Open SVG
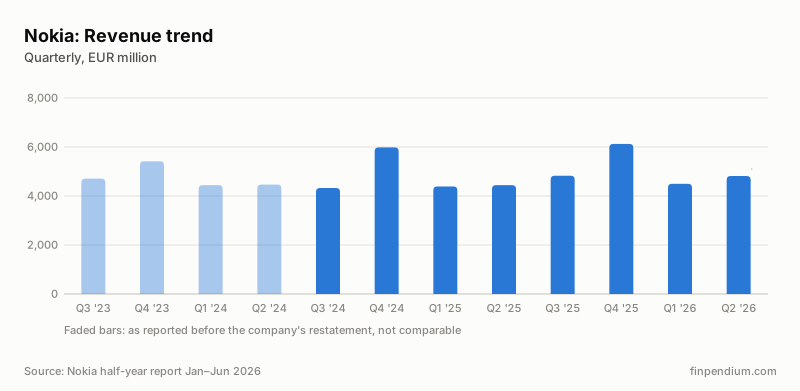
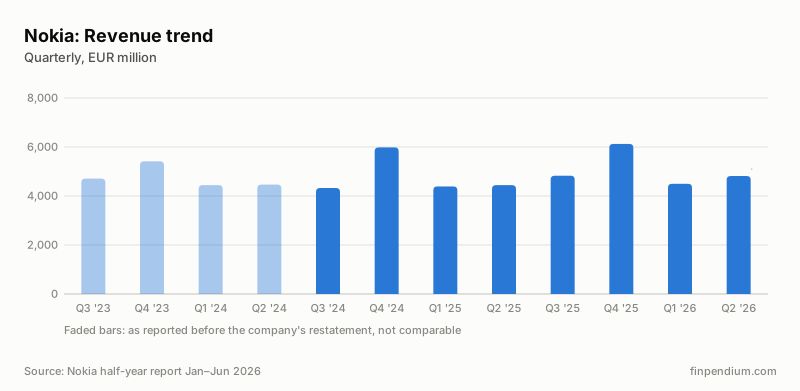
Nokia: Revenue trend · Quarterly, EUR millionEmbed this chart
Free to use with the credit link (CC BY 4.0). The embedded chart stays as it is for Q2 2026; this page shows the latest results. Open SVG
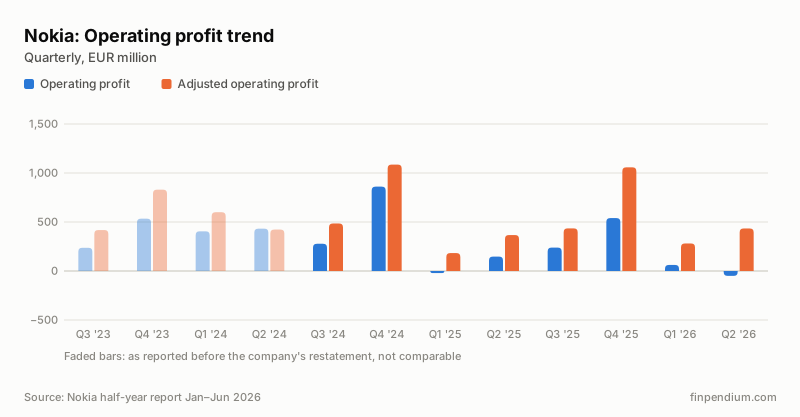
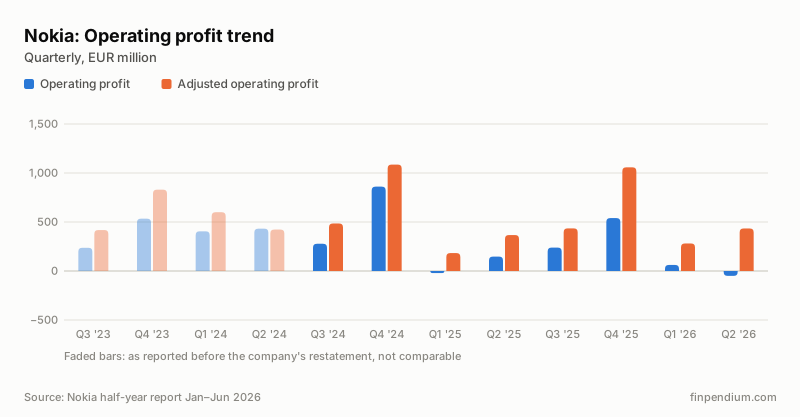
Nokia: Operating profit trend · Quarterly, EUR millionEmbed this chart
Free to use with the credit link (CC BY 4.0). The embedded chart stays as it is for Q2 2026; this page shows the latest results. Open SVG
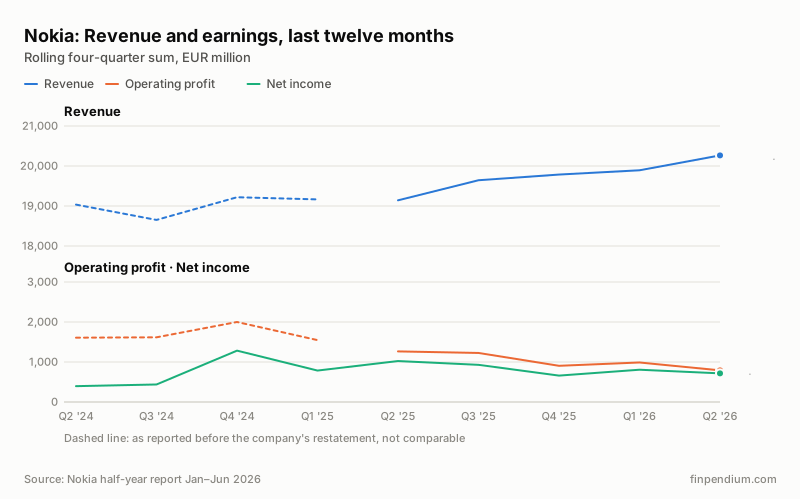
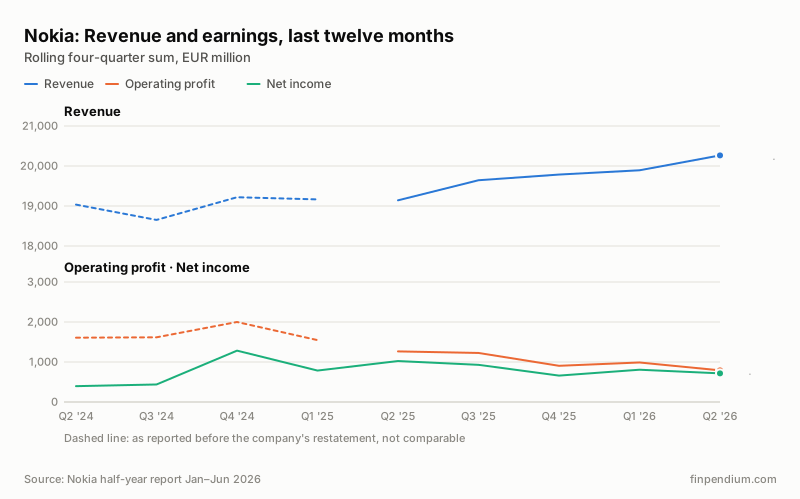
Nokia: Revenue and earnings, last twelve months · Rolling four-quarter sum, EUR millionEmbed this chart
Free to use with the credit link (CC BY 4.0). The embedded chart stays as it is for Q2 2026; this page shows the latest results. Open SVG
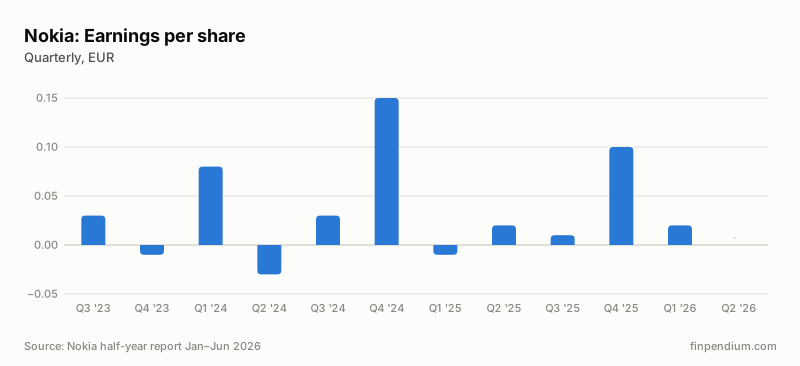
Nokia: Earnings per share · Quarterly, EUREmbed this chart
Free to use with the credit link (CC BY 4.0). The embedded chart stays as it is for Q2 2026; this page shows the latest results. Open SVG
“Board proposal” is the dividend the board proposed in the financial statements release. The annual general meeting usually approves it, but check the company’s AGM release for the final decision. Payout ratio is dividend per share divided by basic earnings per share (payout ratio calculator); N/M means not meaningful (loss).
About these figures. All figures come from Nokia’s published interim
reports and financial statements releases, linked above, and are checked against them before
publication. Errors are still possible, so confirm any figure in the original report before
relying on it. Amounts are in millions of the reporting currency. Quarters reported only
cumulatively (for example the fourth quarter) are derived by subtraction, and when a company
restates earlier figures, older quarters on the previous basis are left out of comparisons.
Margins and changes are calculated by Finpendium. This page is for information only and is
not investment advice or a recommendation to buy or sell any security. See
how the figures are checked and our Disclaimer. Spotted an error? Let us know.