Equinor Results Q2 2026: Revenue, Profit and Margins
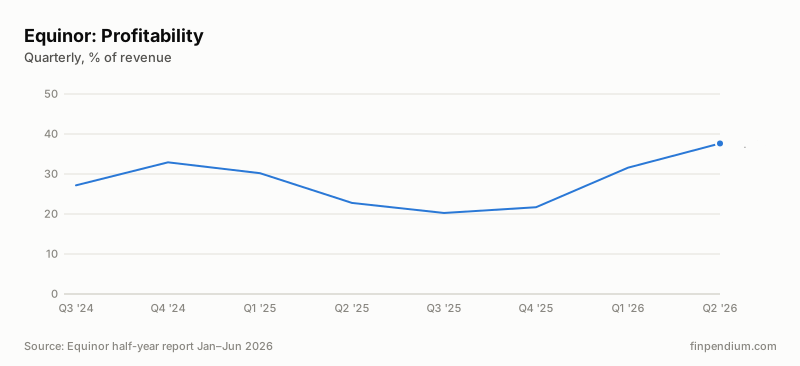
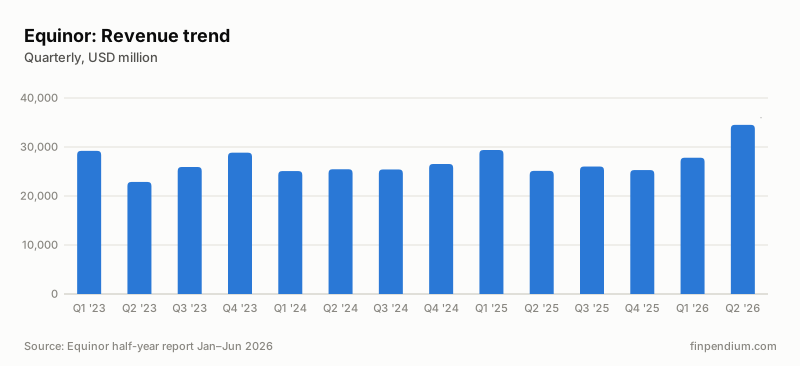
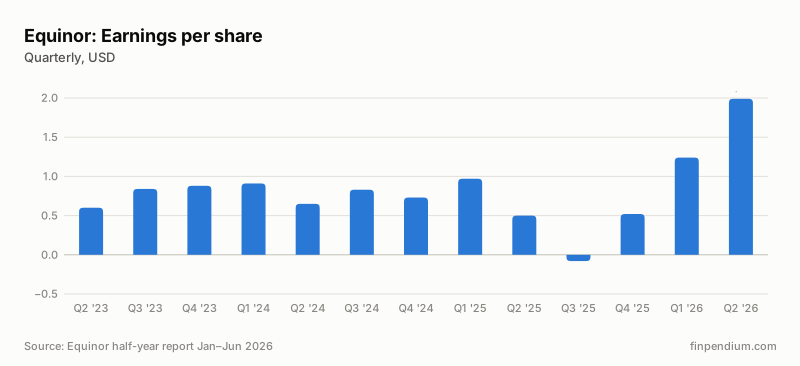
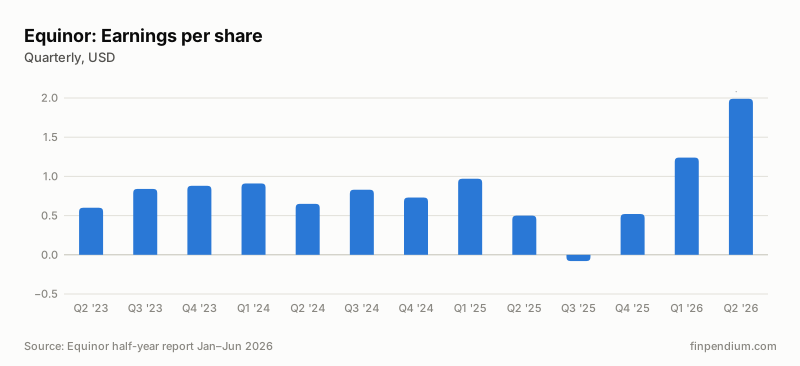
In Q2 2026, Equinor’s revenue was $34,523.0 million, up 37.4% from Q2 2025. Operating profit was $12,993.0 million, an operating margin of 37.6% (Q2 2025: 22.8%). Net income for the period was $4,836.0 million and earnings per share $1.99.
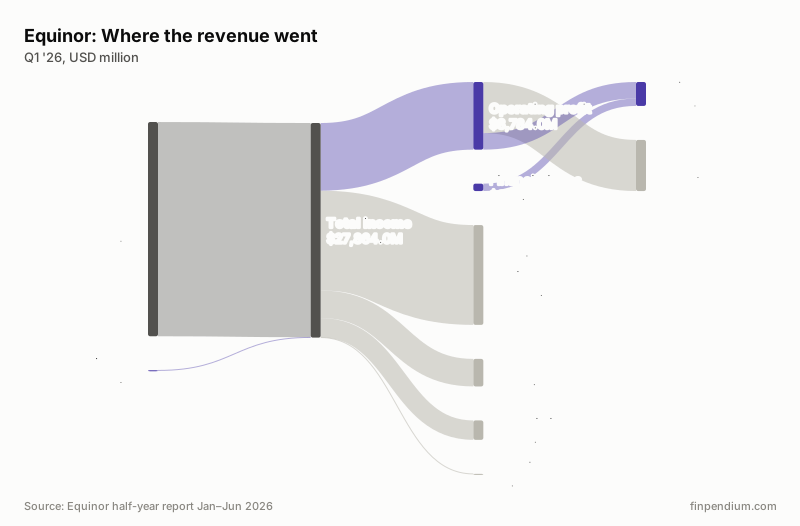
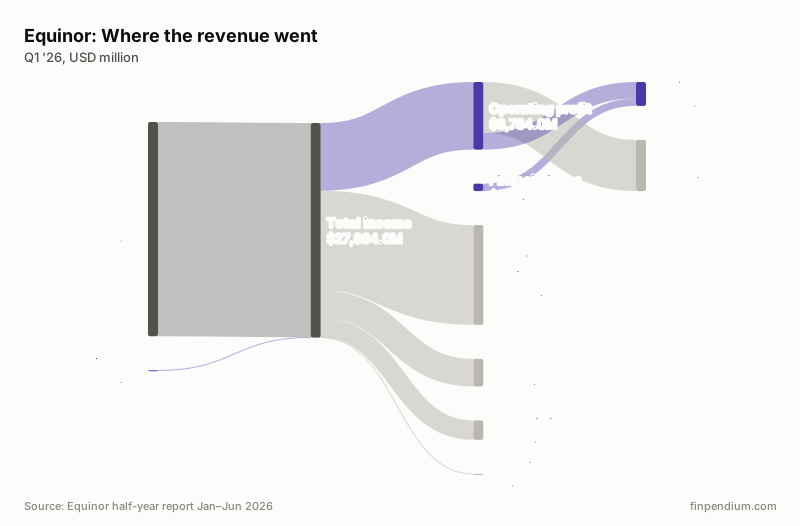
Key figures for Q2 2026
| Q2 2026 | Q2 2025 | Change | |
|---|---|---|---|
| Revenue, $M | 34,523.0 | 25,130.0 | +37.4% |
| Operating profit, $M | 12,993.0 | 5,721.0 | +127.1% |
| Operating margin | 37.6% | 22.8% | +14.9 pp |
| Net income, $M | 4,836.0 | 1,317.0 | +267.2% |
| Net margin | 14.0% | 5.2% | +8.8 pp |
| Earnings per share | $1.99 | $0.50 | +298.0% |
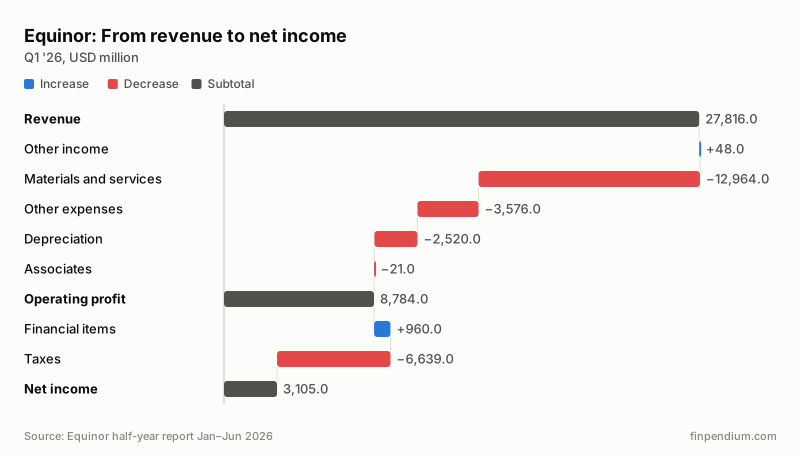
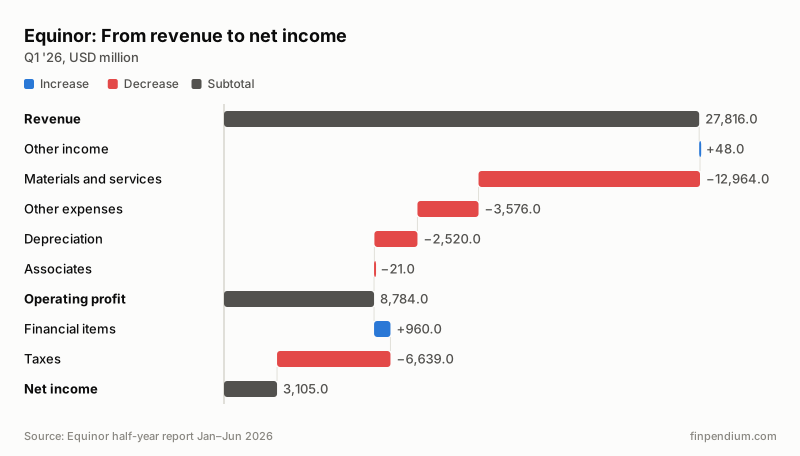
Equinor in charts
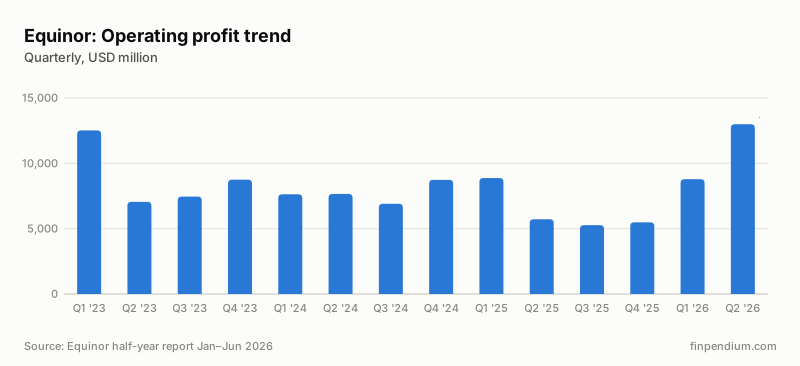
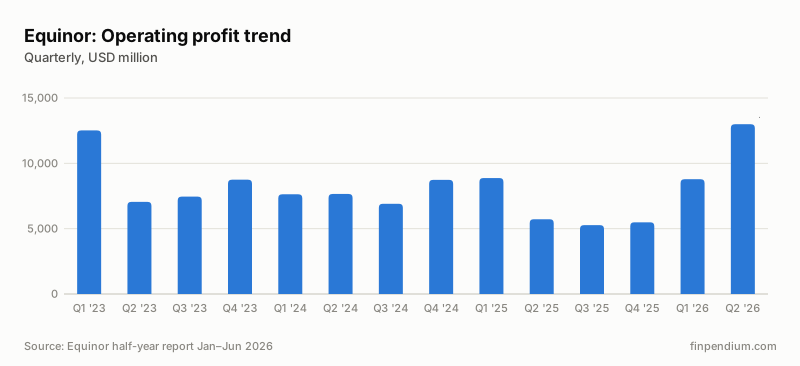
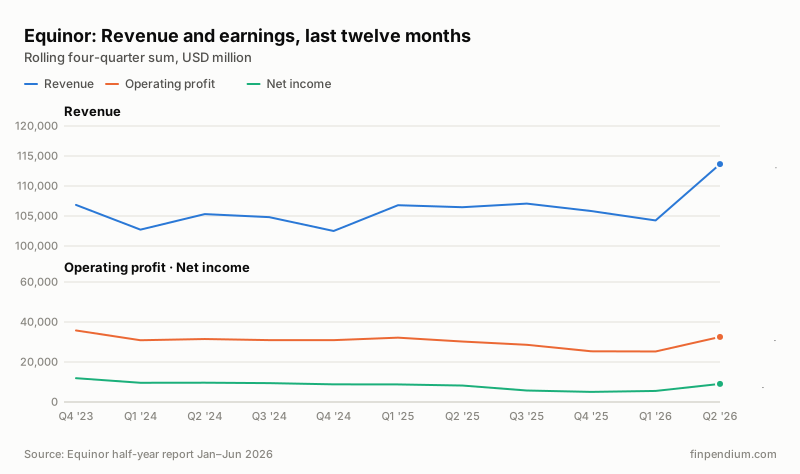
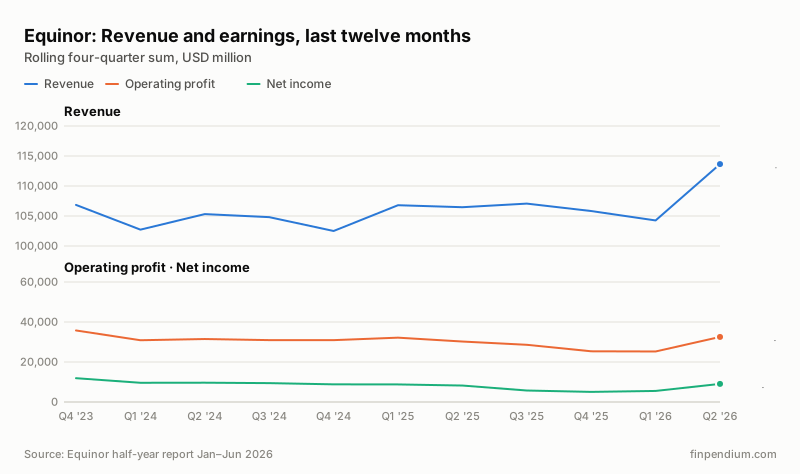
Quarterly results
| Quarter | Revenue | Change y/y | Operating profit | Operating margin | Net income | EPS |
|---|---|---|---|---|---|---|
| Q2 2026 | 34,523.0 | +37.4% | 12,993.0 | 37.6% | 4,836.0 | $1.99 |
| Q1 2026 | 27,816.0 | −5.3% | 8,784.0 | 31.6% | 3,105.0 | $1.24 |
| Q4 2025 | 25,296.0 | −4.7% | 5,487.0 | 21.7% | 1,314.0 | $0.52 |
| Q3 2025 | 26,017.0 | +2.4% | 5,270.0 | 20.3% | −204.0 | −$0.08 |
| Q2 2025 | 25,130.0 | −1.3% | 5,721.0 | 22.8% | 1,317.0 | $0.50 |
| Q1 2025 | 29,384.0 | +17.1% | 8,874.0 | 30.2% | 2,630.0 | $0.97 |
| Q4 2024 | 26,535.0 | −8.0% | 8,735.0 | 32.9% | 1,999.0 | $0.73 |
| Q3 2024 | 25,416.0 | −2.0% | 6,905.0 | 27.2% | 2,285.0 | $0.83 |
Annual results
| Year | Revenue | Operating profit | Operating margin | Net income | EPS |
|---|---|---|---|---|---|
| 2025 | 105,828.0 | 25,352.0 | 24.0% | 5,058.0 | $1.94 |
| 2024 | 102,502.0 | 30,927.0 | 30.2% | 8,829.0 | $3.12 |
| 2023 | 106,848.0 | 35,770.0 | 33.5% | 11,904.0 | $3.93 |
Calculate it yourself
- Operating margin calculatorEquinor in Q2 2026: 37.6%
- Net margin calculatorEquinor in Q2 2026: 14.0%
- Earnings per share calculatorEquinor in Q2 2026: $1.99
About Equinor
Equinor is a Norwegian energy company, majority owned by the Norwegian state, that produces oil and gas, mainly on the Norwegian continental shelf, and invests in renewable energy.
- Equinor half-year report Jan–Jun 2026, published Jul 22, 2026
- Equinor interim report Jan–Mar 2026, published May 6, 2026
- Equinor financial statements release 2025, published Feb 4, 2026
- Equinor interim report Jan–Sep 2025, published Oct 29, 2025
- Equinor half-year report Jan–Jun 2025, published Jul 23, 2025
- Equinor interim report Jan–Mar 2025, published Apr 30, 2025
- Equinor financial statements release 2024, published Feb 5, 2025
- Equinor interim report Jan–Sep 2024, published Oct 24, 2024
- Equinor half-year report Jan–Jun 2024, published Jul 24, 2024
About these figures. All figures come from Equinor’s published interim reports and financial statements releases, linked above, and are checked against them before publication. Errors are still possible, so confirm any figure in the original report before relying on it. Amounts are in millions of the reporting currency. Quarters reported only cumulatively (for example the fourth quarter) are derived by subtraction, and when a company restates earlier figures, older quarters on the previous basis are left out of comparisons. Margins and changes are calculated by Finpendium. This page is for information only and is not investment advice or a recommendation to buy or sell any security. See how the figures are checked and our Disclaimer. Spotted an error? Let us know.